
2018: Threefold increase in projects with natural refrigerants
CAREL solutions have cut atmospheric emissions by almost 4000 tonnes of CO2 equivalent
CAREL can look back at last year’s positive results in terms of energy saving and the use of solutions with natural refrigerants. The number of CO2 projects with DC inverter technology has tripled since 2017, with the purchase of natural refrigerants instead of traditional gases making for a total saving of EUR 1 million.
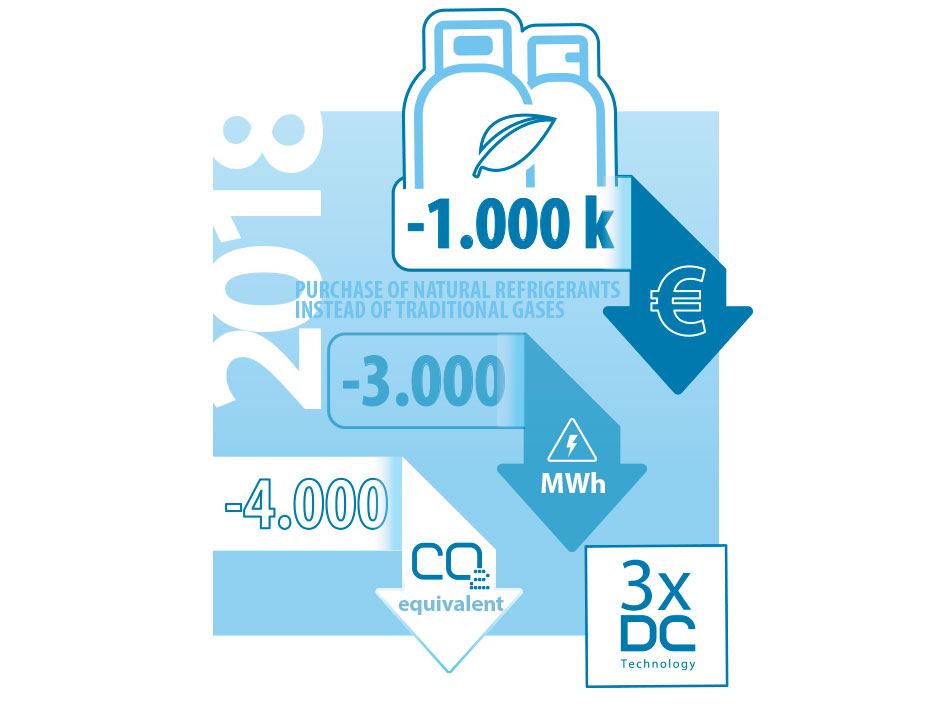
The increase in high-efficiency solutions with natural refrigerants also translates into significant energy savings. It is estimated that the systems sold during 2018 saved almost 3000 MWh of energy, with almost 1500 tonnes less CO2 equivalent released into the environment.
In addition to this, there was also a reduction in polluting gas emissions due to refrigerant leaks from low GWP solutions. In fact, we estimate that our 2018 projects cut environmental emissions by 2500 tons of CO2 equivalent compared to R404/A solutions of equal capacity.
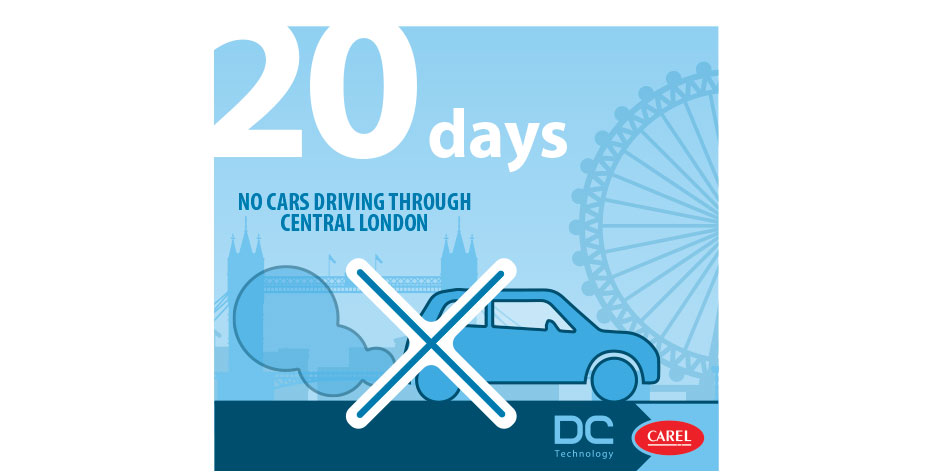
This represents a net and tangible saving of a total of 4000 tons of CO2 equivalent, that is, the equivalent of no cars driving through central London for 20 days*!
In the face of a further increase in global warming, CAREL is contributing to the use of natural refrigerants by developing solutions that simplify their use and increase the efficiency of the system. "Solutions with natural refrigerants represent the present and no longer the future", says Matteo Dal Corso, Application Specialist - Retail Solutions. "Now that the technologies we have developed in recent years are available it is time to focus on innovative features and services, possible thanks to very advanced devices, already installed and ready".
* This refers to the monthly average number of cars entering London’s Congestion Charge Zone on a daily basis ( http://content.tfl.gov.uk/congestion-charge-zone-map.pdf ), according to the data given here: https://data.london.gov.uk/dataset/vehicles-entering-c-charge-zone-month).
The conversion between fuel consumption and CO2 emissions was carried out according to the tables below: http://www.unboscoperlacitta.it/files/Consumi-annui-dei-trasporti-familiari-e-aziendali-.pdf